7.3 EMP_history
The module EMP_history can extract the historical processing records of any result in the EasyMultiProfiler analysis process, which is convenient for users to trace the completed data analysis process.
Note:
Since the R official pipe operator (
Since the R official pipe operator (
|>) uses explicit passing, it may interfere with the traceability feature. If necessary, it is recommended to use the %>% operator for process passing.
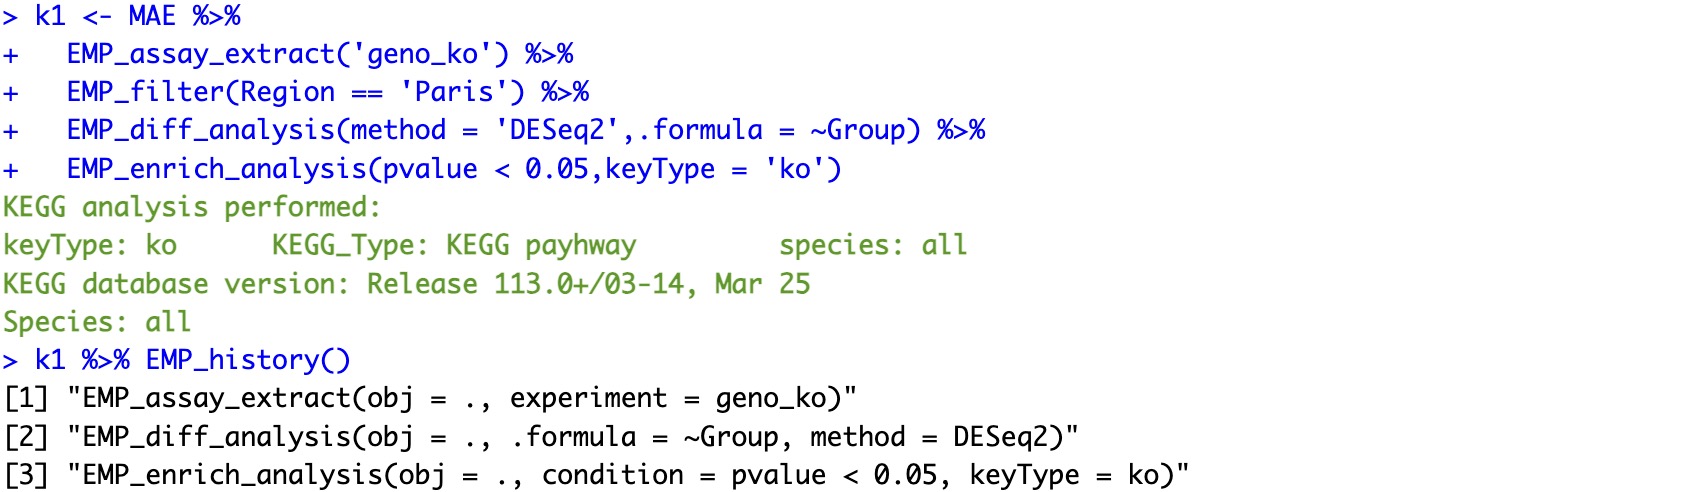
7.3.1 Trace the history of data analysis of single-omic project
library(magrittr)
k1 <- MAE %>%
  EMP_assay_extract('geno_ko') %>%
  EMP_filter(Region == 'Paris') %>%
  EMP_diff_analysis(method = 'DESeq2',.formula = ~Group) %>%
  EMP_enrich_analysis(pvalue < 0.05,keyType = 'ko')
k1 %>% EMP_history()
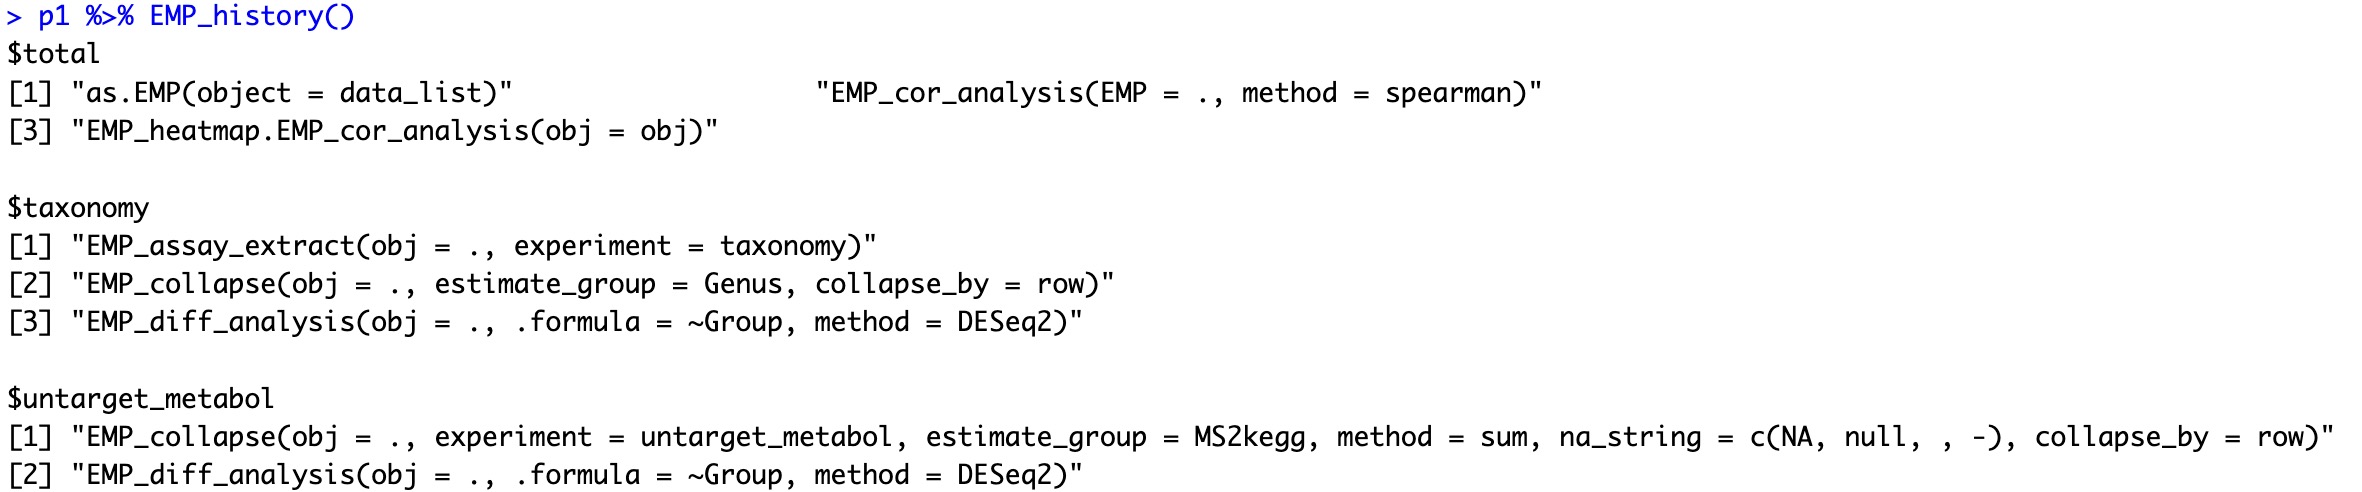
7.3.2 Trace the history of data analysis of multi-omics projects
library(magrittr)
k1 <- MAE %>%
  EMP_assay_extract('taxonomy') %>%
  EMP_collapse(estimate_group = 'Genus',collapse_by = 'row') %>%
  EMP_diff_analysis(method='DESeq2', .formula = ~Group) %>%
  EMP_filter(feature_condition = pvalue<0.05)

k2 <- MAE %>%
  EMP_collapse(experiment = 'untarget_metabol',na_string=c('NA','null','','-'),
               estimate_group = 'MS2kegg',method = 'sum',collapse_by = 'row') %>%
  EMP_diff_analysis(method='DESeq2', .formula = ~Group) %>%
  EMP_filter(feature_condition = pvalue<0.05 & abs(fold_change) > 1.5)

#For two experinemnts
p1 <- (k1 + k2) %>% EMP_cor_analysis(method = 'spearman') %>%
  EMP_heatmap_plot() ## Visualization

p1 %>% EMP_history()